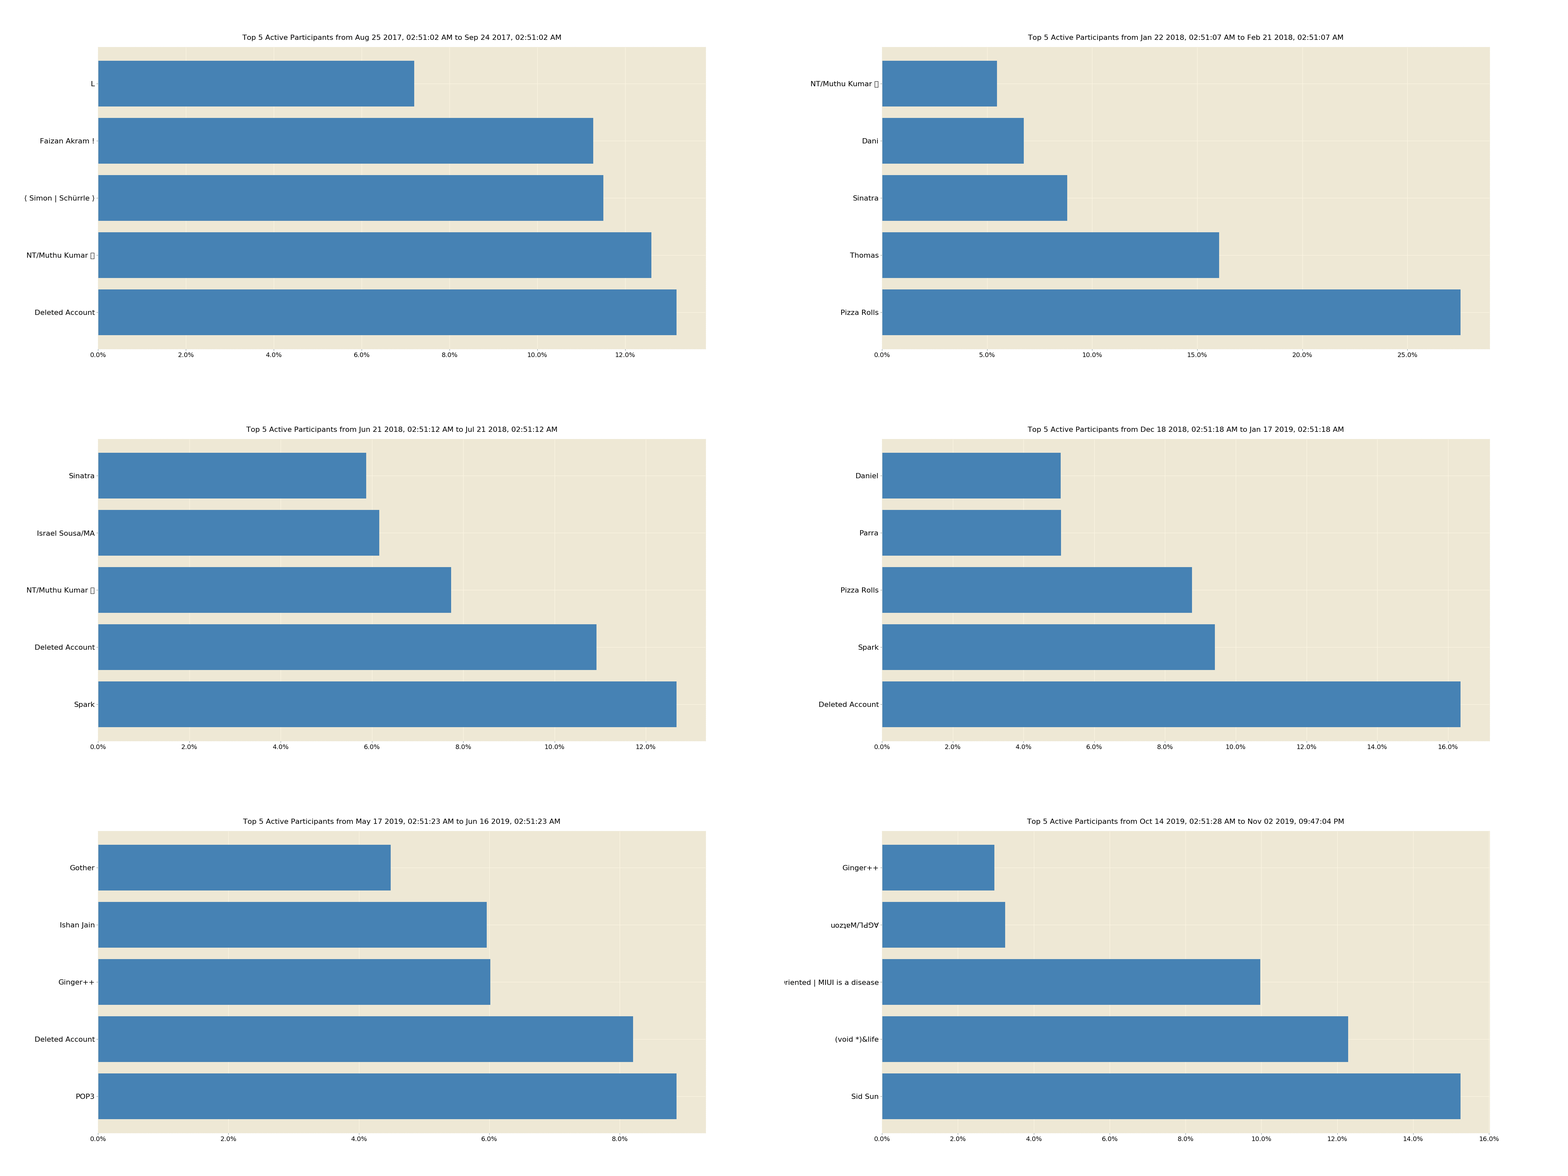
Top ‘X’ Chat Contributor(s) Over Time
Here we try to understand how top ‘X’ positions of Active Chat Participant(s) changed over time i.e. over whole period of time for which we’ve collected Chat data.
Lets just assume, we want to study status of top 5 active chat participants’ position, over a long period of time, while every 30 days’ chat contribution will be accumulated into a set, and contributor graph for that 30 days slot to be generated.
As testing data, I’m using prementioned Devs Chat’s Chat record, from day 0 to 03/11/2019.
So, I splitted almost 2 year lengthy chat record into ~ 26 slots ( each of 30 days length ), calculating top 5 active chat participant’s for each of those time periods and plotting them in horizontal bar chart in animated fashion.
